Grafana
Access logs are an essential part of effective cybersecurity monitoring. They give WEDOS.protection users clear insight into where traffic is coming from, when requests occur, and how often they reach the web server. This makes it easier to detect anomalies, identify suspicious activity, and see how WEDOS.protection is actively protecting the website.
About Grafana
Grafana is a powerful visualization tool integrated with WEDOS.protection that provides extensive traffic statistics and logs. It allows you to monitor live traffic, analyze historical data, create detailed reports, and better understand request patterns, client behavior, and potential security events.
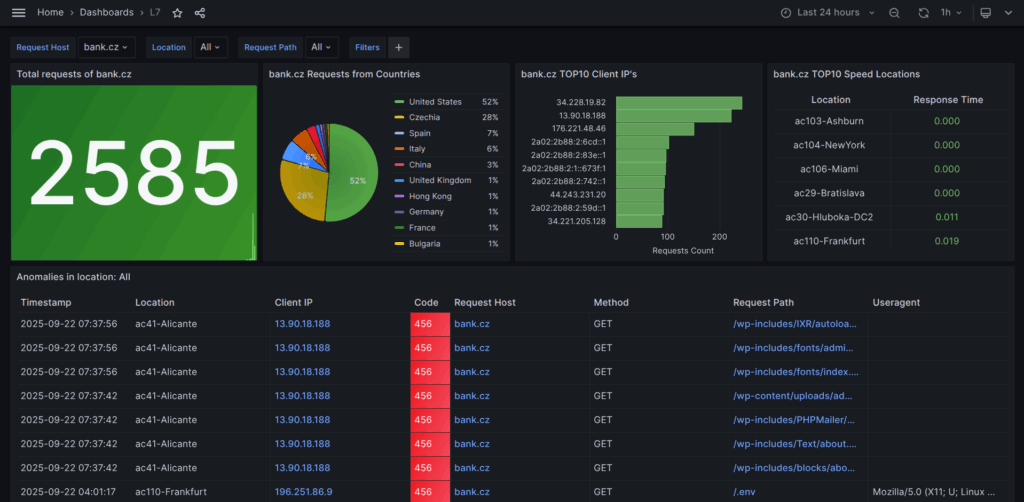
The Grafana dashboard displays a number of metrics:
- Total requests
- Request distribution by country
- TOP10 client IPs
- TOP10 locations by speed
- Anomalies by location
- Regular traffic by location
- All traffic in locations
- Unique IP count
- HTTP response code, method, and version
- TOP10 URLs
- User Agents
- All requests by time
- Access distribution by ASN
- and more!
Accessing Grafana
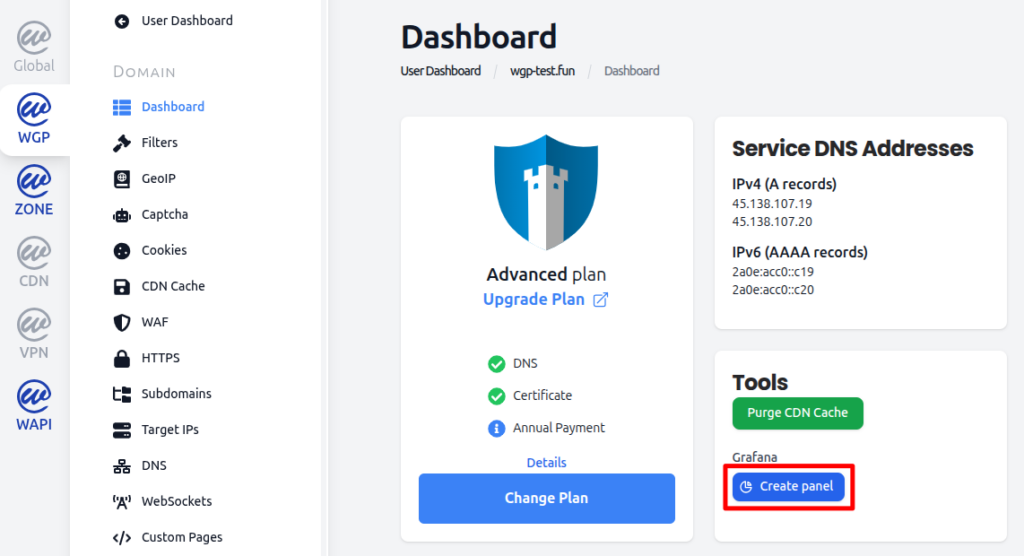
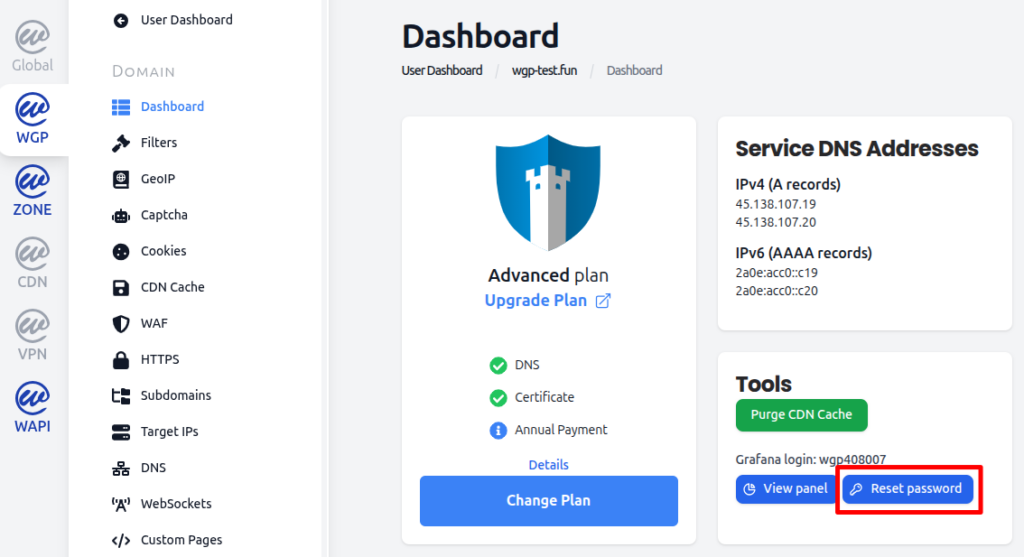
To start using Grafana for the first time, log in to your WEDOS.global account and select an active domain in the WGP panel. In the Tools section of the dashboard, click Create panel and then create a password that will be used to access Grafana.
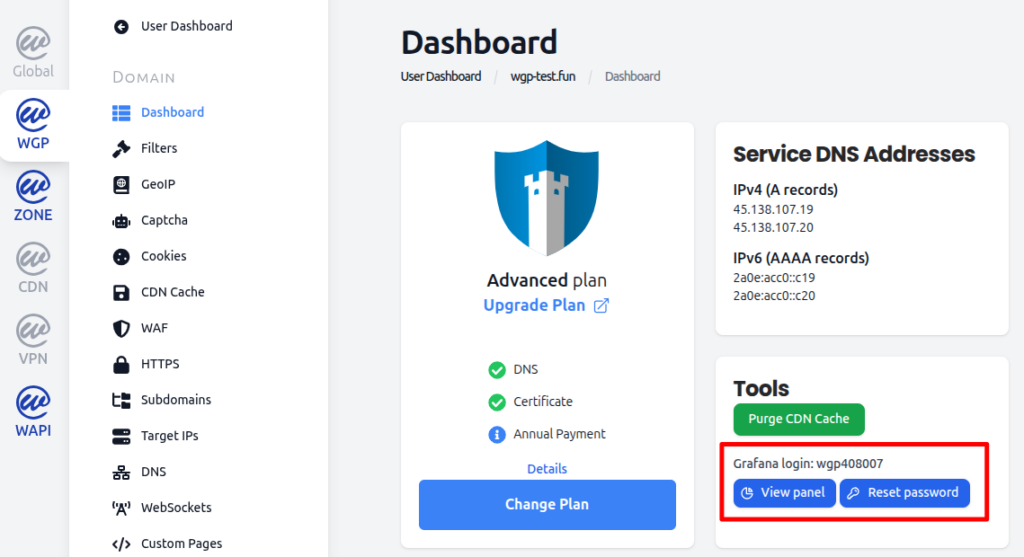
The system will generate a Grafana login username – refresh the browser window if necessary. Now you can log in to Grafana by returning to the Tools section in the WGP dashboard. Copy the system-generated username and click View panel.
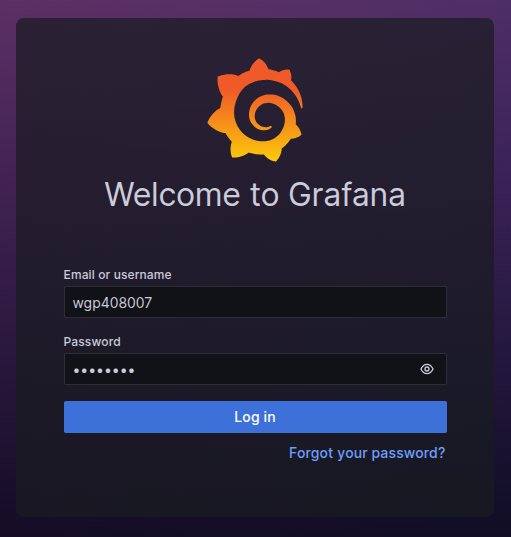
Enter your username and password to log in to the Grafana interface.
You will then be able to explore logs and visual statistics relevant to your protected domains.
Filters in Grafana
The Grafana panel is shared across all protected domains in your account. To visualize log data for a specific domain or group of domains, use the Request Host filter at the top of the Grafana interface. Select the domain(s) you want to analyze and Grafana will display log data based on your selection.
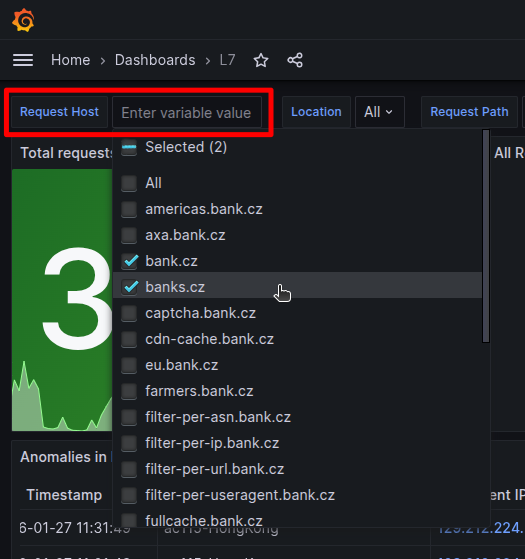
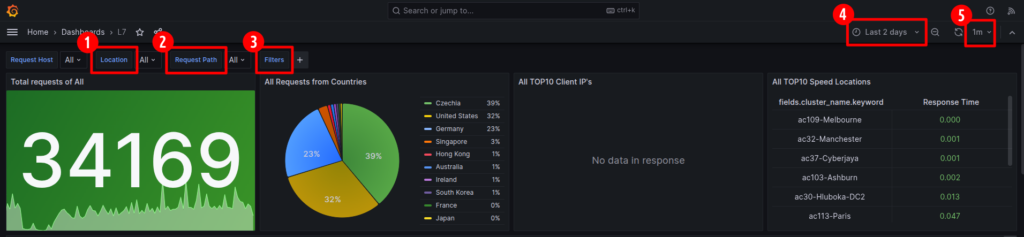
For even more granular results, you can also filter by:
- Edge location. View data from a specific edge server (Point of Presence).
- Request path. View data from a specific URL path (for example
/wp-login). - Filters. Use filters to narrow results by metric and condition (for example
http_response_code != 200). You can also filter by clicking the plus magnifying glass next to a valid metric. - Timeframe. Specify the time range from which the data will be sourced.
- Auto refresh interval. Set how often data is refreshed or disable auto refresh.
Navigating Log Insights
Grafana provides useful metrics to help you identify abnormal behavior, attacks, or traffic spikes.
Useful Metrics and how to use them:
- Total requests. Overview of total incoming traffic with a graph to see activity over time.
- Request distribution by country. Gain insight into geographic traffic sources. Verify if any unwanted countries are accessing your website.
- TOP10 IPs. See which IP addresses generate the most traffic. Verify that IPs which are sending too many requests are not malicious by clicking on IP address to view abuseipdb.com entry.
- Anomalies. Traffic blocked by WGP (HTTP response codes 429 and 456). Gain insight into malicious traffic, request details, and attack patterns.
- All/Normal traffic. Successful (unblocked) traffic (HTTP response codes 200 and 302). Verify that there is not any malicious traffic that gets through.
- HTTP response code, methods, and versions. Gain insight into HTTP request behavior and filter by HTTP response code or version.
- TOP10 URLs/Request path. See which URL paths are requested the most. Look for suspicious activity (for example
/wp-loginor/wp-admin/) - TOP10 User Agent. Identify patterns in User Agents requests that can be filtered out using WGP filters.
Generating Reports in Grafana
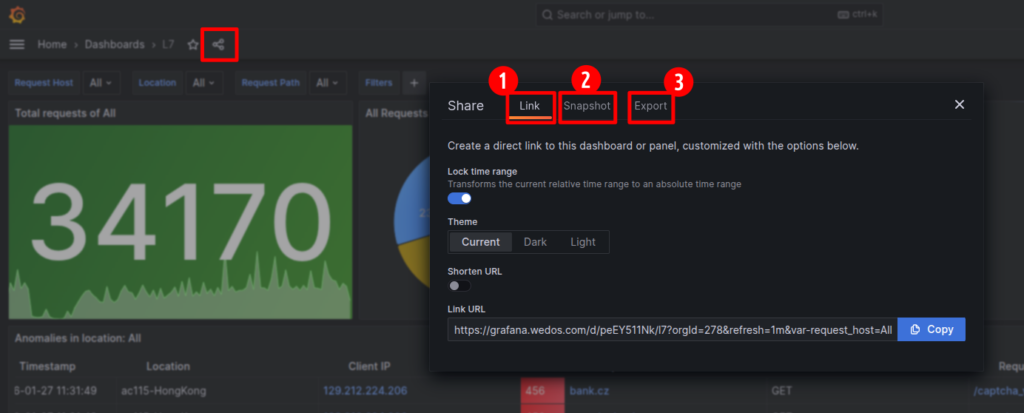
To generate a report click on the share icon and select the method that fits your needs:
- Link. Create a URL to share with another Grafana user.
- Snapshot. Create a public URL of an interactive dashboard showing the current Grafana dashboard without any sensitive data.
- Export. Copy or download a JSON file with data from the current Grafana dashboard.
Managing Grafana
You can reset your Grafana password at any time from the WGP dashboard of any active domain by clicking on Reset password in the Tools section.
To log out of Grafana, use the link https://grafana.wedos.com/logout